Our services
Effective July 16, 2018 Google Maps pricing changed. Previously Google granted all users of its Maps API 25,000 free page loads a day, now the company begin charging $200 per month for 28,000 page loads of Google’s Dynamic Maps feature starting July 16, 2018. The price increase is 1400% percent (from $0.5 to $7 for extra 1.000 map views). We understand that this would affect the budget of multiple web mapping applications and we want to offer our help.
If you are considering switching from Google Maps, OpenStreet based of maps could be an alternative of choice. MapBox and OpenMapTiles are examples of providers with curated OpenStreetMap and strong API to style and serve vector world tiles.
We offer help to transition your web mapping application to curated OpenStreetMap. Specifically, we offer a full service to transition to:
- Leaflet API to serve raster map tiles tiles (OpenStreetMap, ESRI, etc.) with your geospatial data, or/and
- MapBoxGl API to serve openstreet vector tiles (Mapbox, OpenMapTiles, etc.) with your geospatial data
Our service is composed of a FREE evaluation of your current web mapping application to study it and produce a proposal for the transition with milestones and pricing. Considering switching from Google Maps, contact us to get your free estimate.
Why contact us ?
Our team have expertise in Leaflet, Mapbox GL and Google map API since we have implemented web applications for all those API into our store locator product. We also have extensive experience with GIS data and spatial analysis.
See our Showcases for some of the web maps we have authored.
“A picture is worth a thousand word”. This is also true when a picture is of a geographic area that changes happen over time. Examples of such changes are: a new housing development, a new stadium was built, deforestation, etc. To help decision makers monitor land use use change over time, we offer an interactive web tool that shows in an intuitive way how the land use changes happen over the years.
One can simply slide the vertical line left and right to see how the land use was before or after. Since this is an interactive tool, one can zoom in to see more details and pan to move to different area. Also changing the years is accessible by sampling clicking on the combo box of the year on the bottom left and right of the web page. Another nice feature is the ability to print out the state of the land in any of the area zoomed in for the before and after the year. This could be handy when such output is needed for a report to stack holders for better decision making. Beside monitoring land use changes over time for planning and changes study, this tool could be also used for example to monitor housing expansion that were not permitted by the town/county.
Below is a our Land use change tool showing the County of Rensselaer, New York (USA). Give it a try:

Would you like to have such tool and use it in your internal or external web site ? Simply get in touch with us. We would only need your images and their dates. The rest is on us. We are ready to produce your land use web page.
Having few hundreds of geospatial records (point of interest, roads, rivers, etc.) served in an interactive web application is one thing. Serving however thousands or millions of geospatial records is another thing. We offer creating your web mapping application that display multiple thousands and even millions of records in a web browser with high performance. We also offer custom styling and design for your mapping application.
Below is our web map for the city of New York (USA) that displays ~ 1.8 million building footprints:
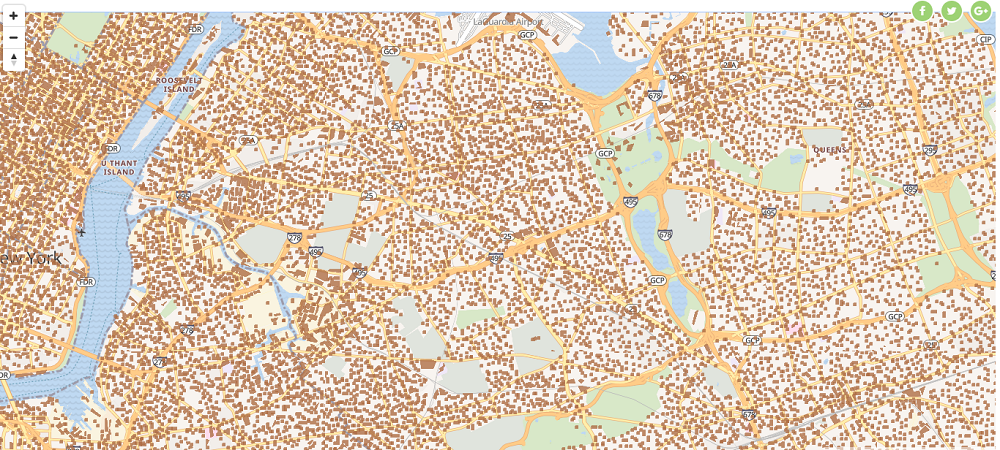
Have a need to produce a web map with large geospatial data ? Contact us and we will work with you to custom design it.